Figure 1-3: (Left) L-band receiver for the 40-m TNRT. (Right) Diagram from the feed horn to the output through A/D digitizing in the receiver box (Photo/Image credits: Gundolf Wieching, Christoph Kasemann, et al., MPIfR).
Frontend
A cryogenic L-band receiver was designed especially for installing on the 40-m TNRT, by Gundolf Wieching, Christoph Kasemann, et al. in MPIfR. As shown in figure 1-3, this receiver is constituted by an axial corrugated feed with 5 corrugations, a weather protection at the front of the feed made out of a teflon / fiberglas compound, an orthomode transducer (OMT), a cryo cooler, a noise source for amplitude calibration, and low-noise amplifiers (LNAs). The analog-to-digital digitization for both horizontal and vertical linear polarizations is also performed in the receiver box for 1.0-1.8 GHz with 8-bit sampling. The performance of this L-band receiver was verified via measuring the receiver noise temperatures Trx with a waveguide to coax adapter in a stand-alone situation by the hot-cold method (hot: room temperature / cold: 77 K). As presented in figure 1-4, both horizontal and vertical polarization data achieved the receiver noise temperatures averagely lower than 8 K (Trx < 8 K), which represents that this L-band receiver is one of the best low-noise sensitive performance receivers in the world. In this cycle 0 CfP, a part of the effective bandwidth is provided for the open-use observations: 1.63-1.67 GHz as the most stable frequency range net in the current L-band system.
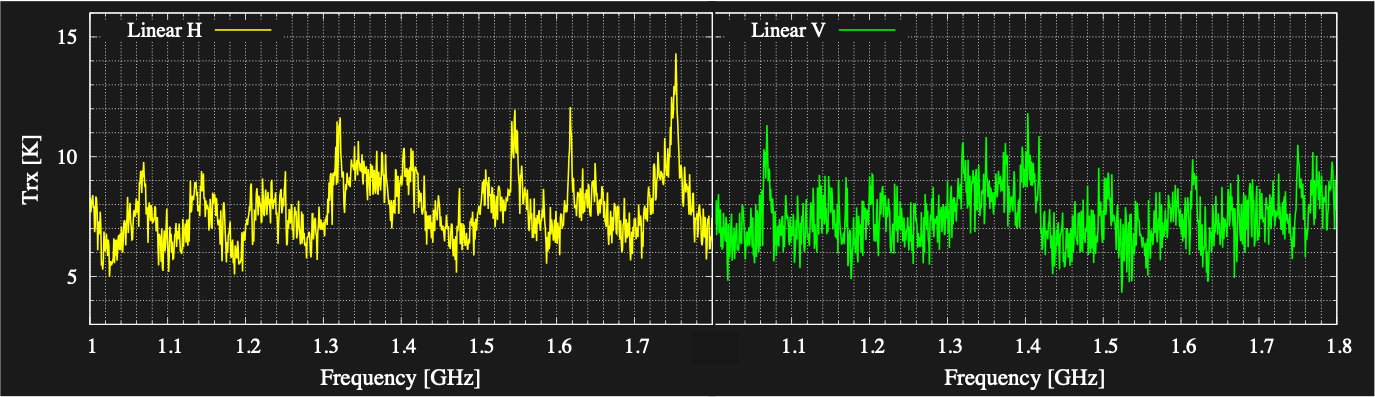
Figure 1-4: Receiver noise temperature measured with a waveguide to coax adapter in a stand-alone situation by the hot-cold method (hot: room temperature / cold: 77 K) for Horizontal (left) and Vertical (right) linear polarizations, respectively, conducted by MPIfR.
Backend
The TNRT Universal Software Backend (USB, figure 1-5 left) is a system that enables any TNRT receiver instrument to use any available signal processing pipeline and data product, developed in collaboration with MPIfR. The system includes a collection of computing resources (GPU, CPU, FPGA (Field Programmable Gate Array)) interconnected by high-speed LAN connections on premise at TNRT. Configuration files and software determine the routing of packetized Intermediate Frequency (IF) signal data between the receiver instruments and computing resources. This software-defined architecture eliminates the need to switch analog IF to achieve the desired system configuration. This USB achieves packetizing the digital signals output from the receivers and it is transported on standard 40 GbE LAN into multiple observation modes consisting of 1) pulsar with coherent dedispersion, baseband and search mode recording; 2) spectrometer; 3) polarimeter; and 4) Very Long Baseline Interferometry (VLBI) with vdif format. As shown in figure 1-5 (right) for diagram of packetizing and recording data flow, in this cycle 0 CfP, a part of this recording system for, "spectrum V-pol 0 and 1" enclosed by the blue line in the diagram is provided for the open-use observations: the spectrometer mode for spectral lines / continuum emissions with a vertical linear polarization (with and without injecting the noise-source).
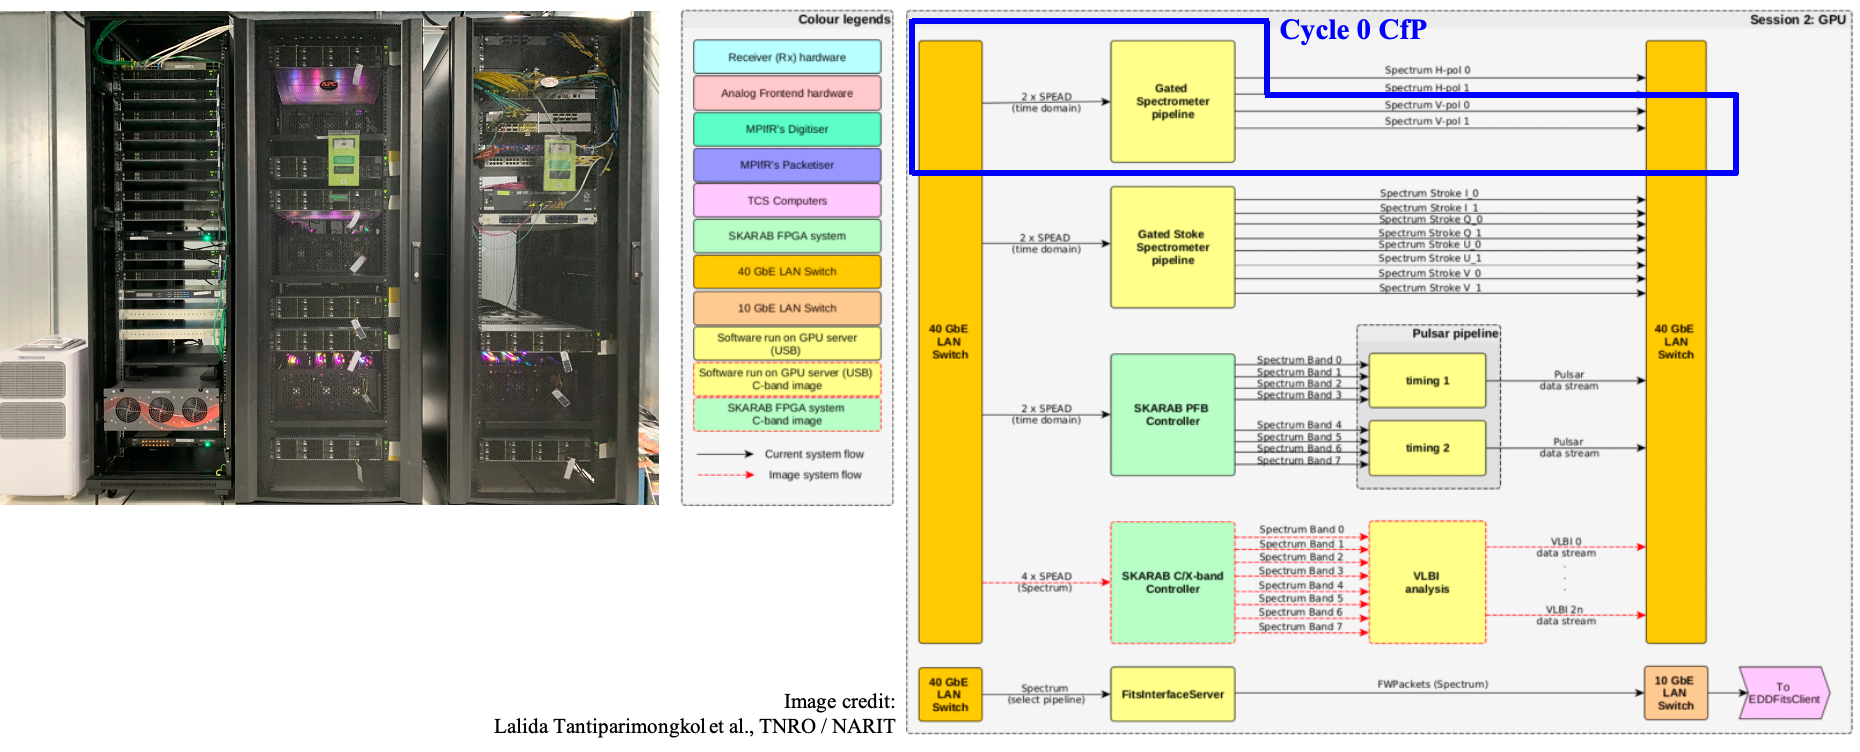
Figure 1-5: (Left) USB installed at TNRO site for the 40-m TNRT. (Right) Diagram for packetizing and recording data flow in the USB for the multiple observation modes (image credit: Lalida Tantiparimongkol et al., TNRO / NARIT).