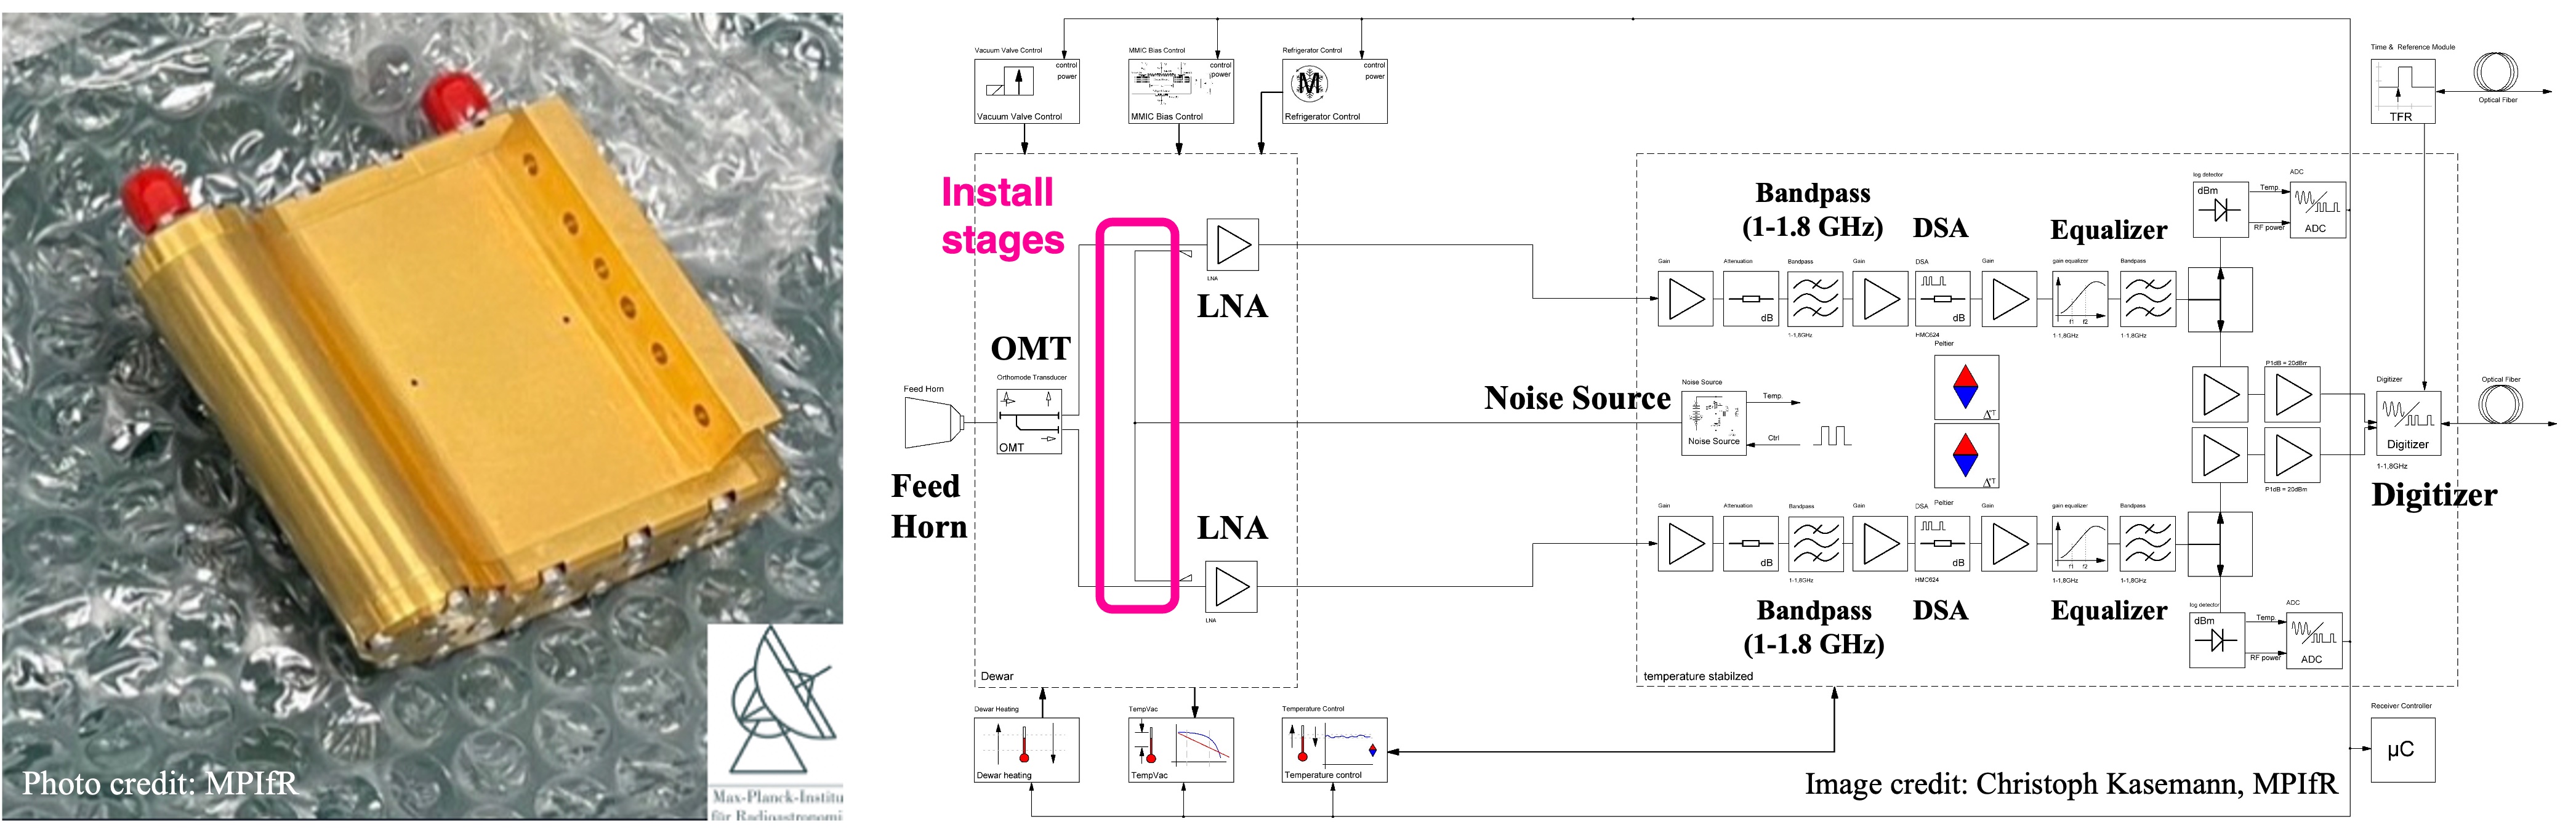
Figure 0-6: (Left) Low-noise high-/low-bandpass filters developed by MPIfR for TNRT linear polarizations. (Right) Diagram with presenting the installation stages, which are at just before the first LNAs as being enclosed by a magenta rectangle (Photo/Image credits: Gundolf Wieching, Christoph Kasemann, et al., MPIfR).
Although the TNRO site is designated as Radio Quiet Zone, there were noticeable disruptive RFIs at some critical zones badly impacting on total-power of the 40-m TNRT in variety of sky directions, even at higher elevations and particularly in the southeast direction. It resulted in total-power saturation that might damage the receiver and we had no choices to switch off the LNAs often.
Max Planck Institute for Radio astronomy (MPIfR) electronics division team (Gundolf Wieching, Christoph Kasemann, Rafael Castenholz, et al.) thus kindly produced low-noise high-/low-bandpass filters for each TNRT linear polarization (figure 0-6 left). These filters were installed at just before the first LNAs in mid-November 2023, as shown in figure 0-6 (right). The filters achieved cutting off the edge of outside of effective bandwidth in the TNRT L-band system by around 80 dB at maximum, resulting in attenuating 40-50 dB at the edge of the bandwidth as net in the system. This upgrade brought about remarkable results to mitigate RFI bad impacts and intermodulation signals folded from the out-band (f < 1.0 GHz and f > 1.8 GHz).
This remarkable positive impact is visualized in figure 0-7 below, which is a comparison of skyline bird's-eye view maps for all the directions observed with the 40-m TNRT in L-band BEFORE (left, in April 2023) and AFTER (right, in March 2024) the installation of low-noise filters. In the left panel of figure 0-7 for the case before the installation, there are zones achieving the best system noise temperature Tsys* of around 15-30 K but restricted only in the half of the northern hemisphere (roughly in 270 < AZ < 45 deg through due north), while other zones presented moderate Tsys* or worse and resulted in the total-power saturation with enforcing to switch off the LNAs particularly to the south-east directions even at higher elevations (corresponding to the zones color coded by red and deep red on the map). On the other hand in the right panel of figure 0-7, you can find clearly that the filter installation realized the best Tsys* of around 15-30 K (color coded by deep blue on the map) in most of directions and zones covering both the northern and southern hemisphere, except for only elevations lower than 10 deg at the east, south, and west directions. For skylines in other observable frequencies, please see section 6 "Skyline Bird's-eye View Maps" in "Status Report" tab.
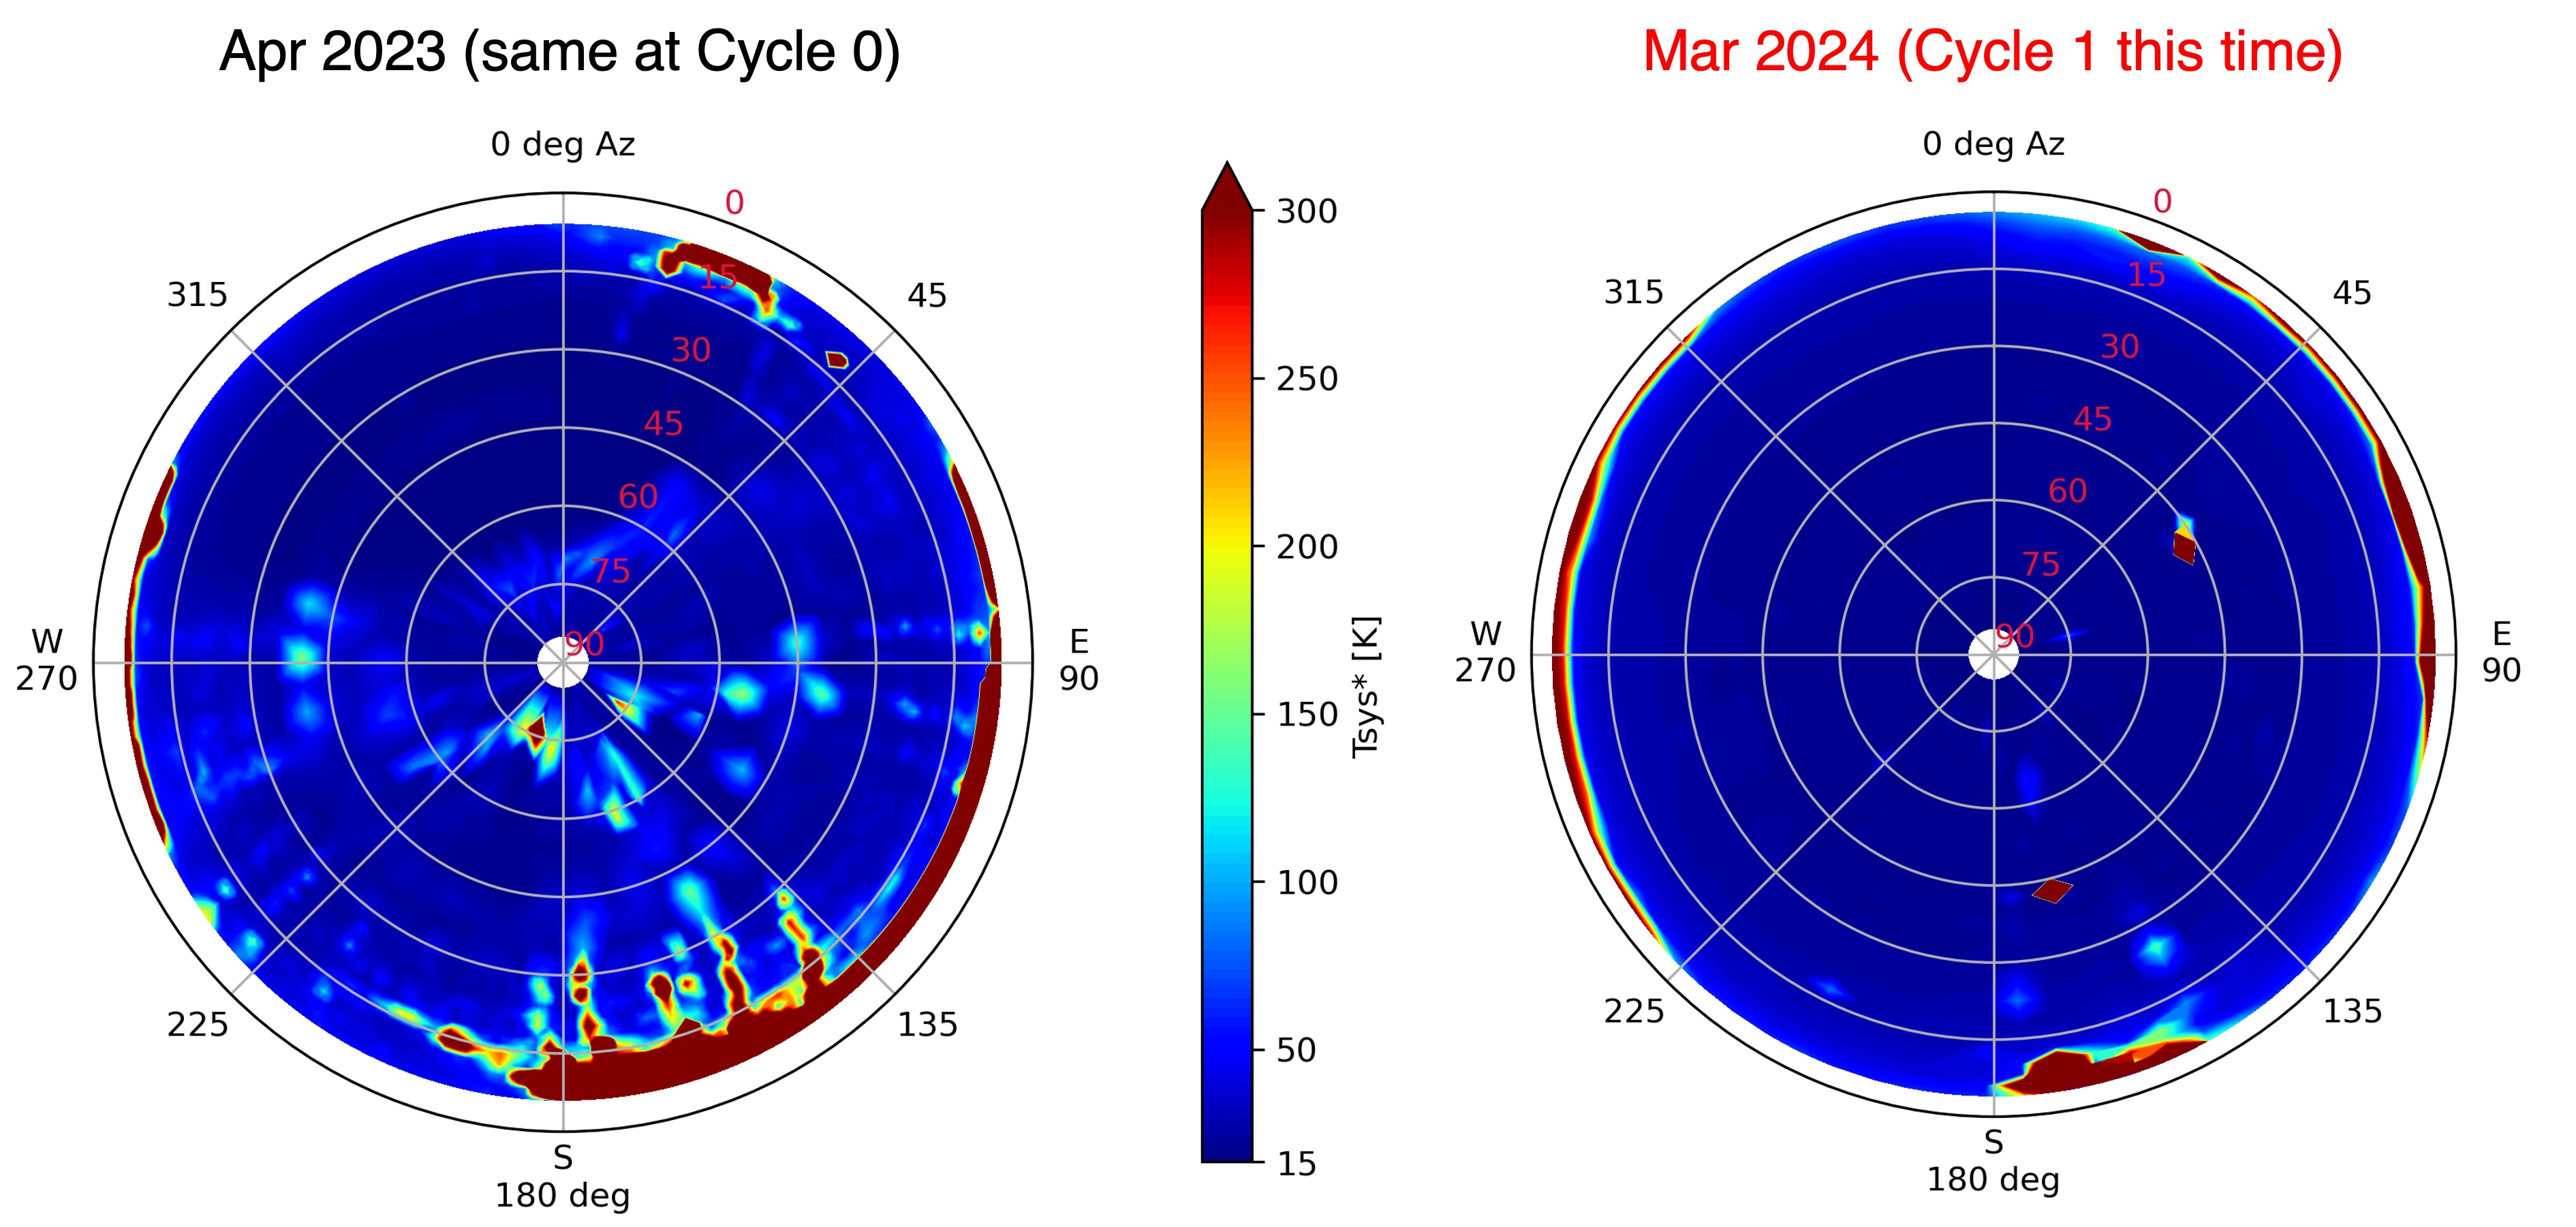
Figure 0-7: Skyline bird's-eye view maps observed with the 40-m TNRT L-band integrated in 1.63-1.67 GHz for vertical linear polarization. Color code represents Tsys* [K] in the range of 15 - 300 K both on the maps (see the color scale at the center). Tsys* beyond the maximum value both in each plot is unified to be shown by deep red code. (Left) Skyline observed in April 2023, before installation of the low-noise filter. (Right) Skyline observed in March 2024, after the installation, and to be the situation in Call for Proposals, Cycle 1 this time.
More in detail to verify this improvement with mitigation of RFI impacts and of intermodulation folded from the out-band on TNRT L-band spectra, on 23rd November 2023 we conducted quick commissioning through sky observations pointing to areas that showed the best Tsys*, moderate Tsys* (roughly two times worse), and much worse Tsys*, selected on the skyline map of April 2023. The results are presented in figure 0-8 below. The upper panel shows comparison of spectra in the case at one of the best Tsys* areas observed before and after installing the filters, color coded by white and cyan, respectively. Even in this area, the after spectrum shows success of attenuating power in the out-band near the edge of effective bandwidths by around 10 dB. The middle panel of the case at one of moderate Tsys* areas presents remarkable improvement on spectra comparison, that is success of attenuating power in the out-band near the edge of effective bandwidths by around 20 dB, and of cancelling intermodulation signals out in particular around the edges of in-band (1.0 and 1.8 GHz) and the range of 1.4-1.5 GHz. At the end, the lower panel gave the most impressive impact with dramatic modification seen on spectra observed at one of the much worse Tsys* areas in the southeast direction with lower elevation. As shown by color codes of white and orange for before and after the installation, base-band total power not only at out-band but also in-band is improved to be compatible to other better Tsys* areas through attenuating the overmuch power by 10-30 dB, resulting in proper Tsys* even in lower elevations near RFI dangerous zones and operations without switching off the LNAs often anymore.
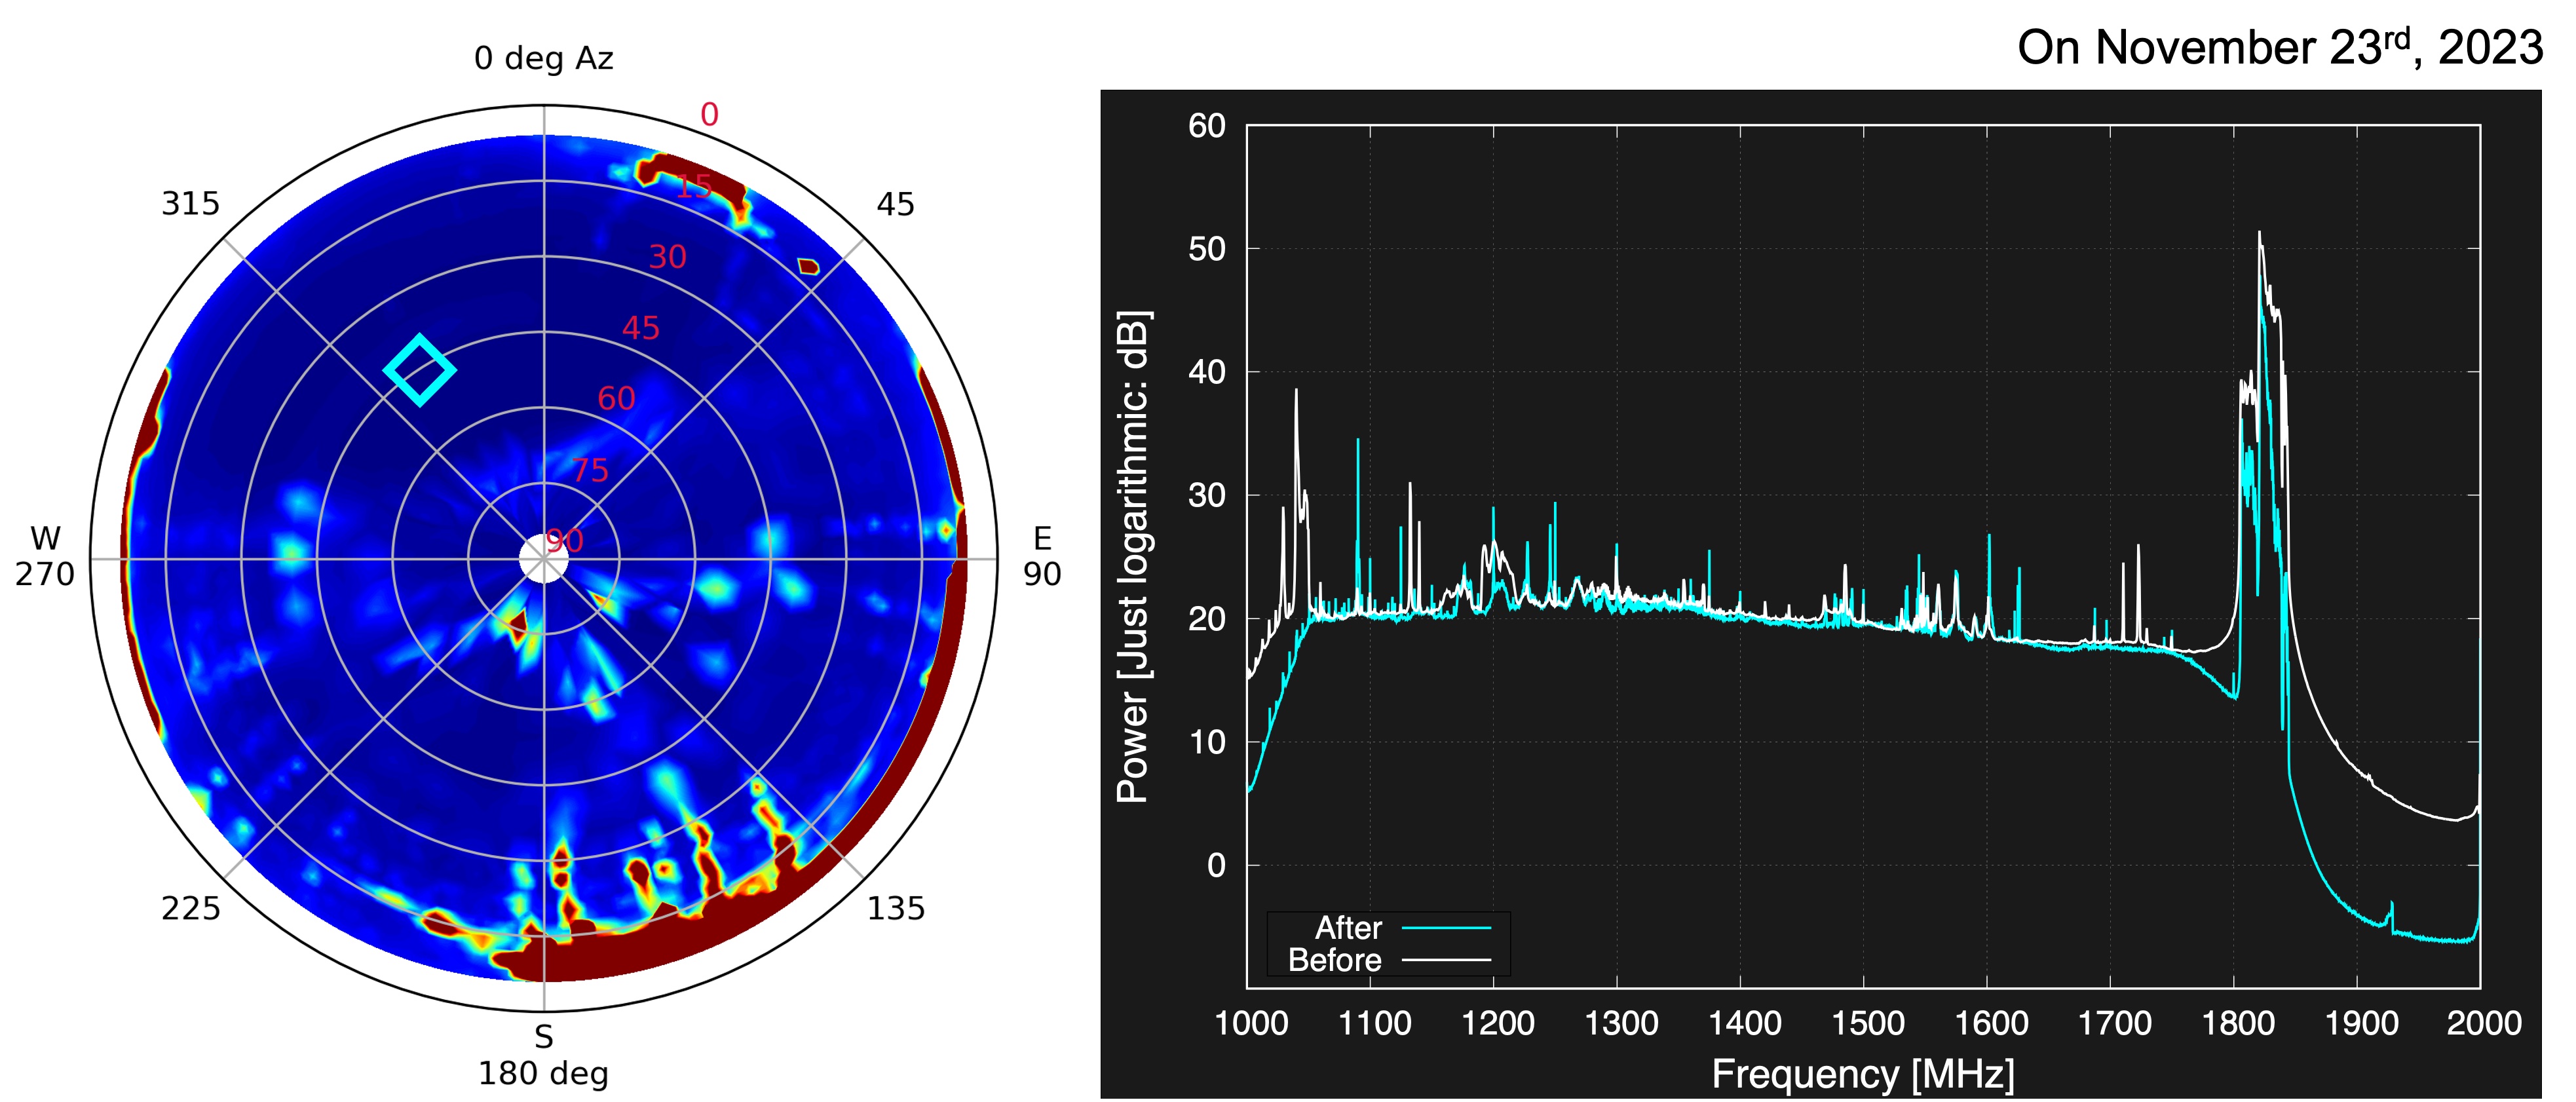
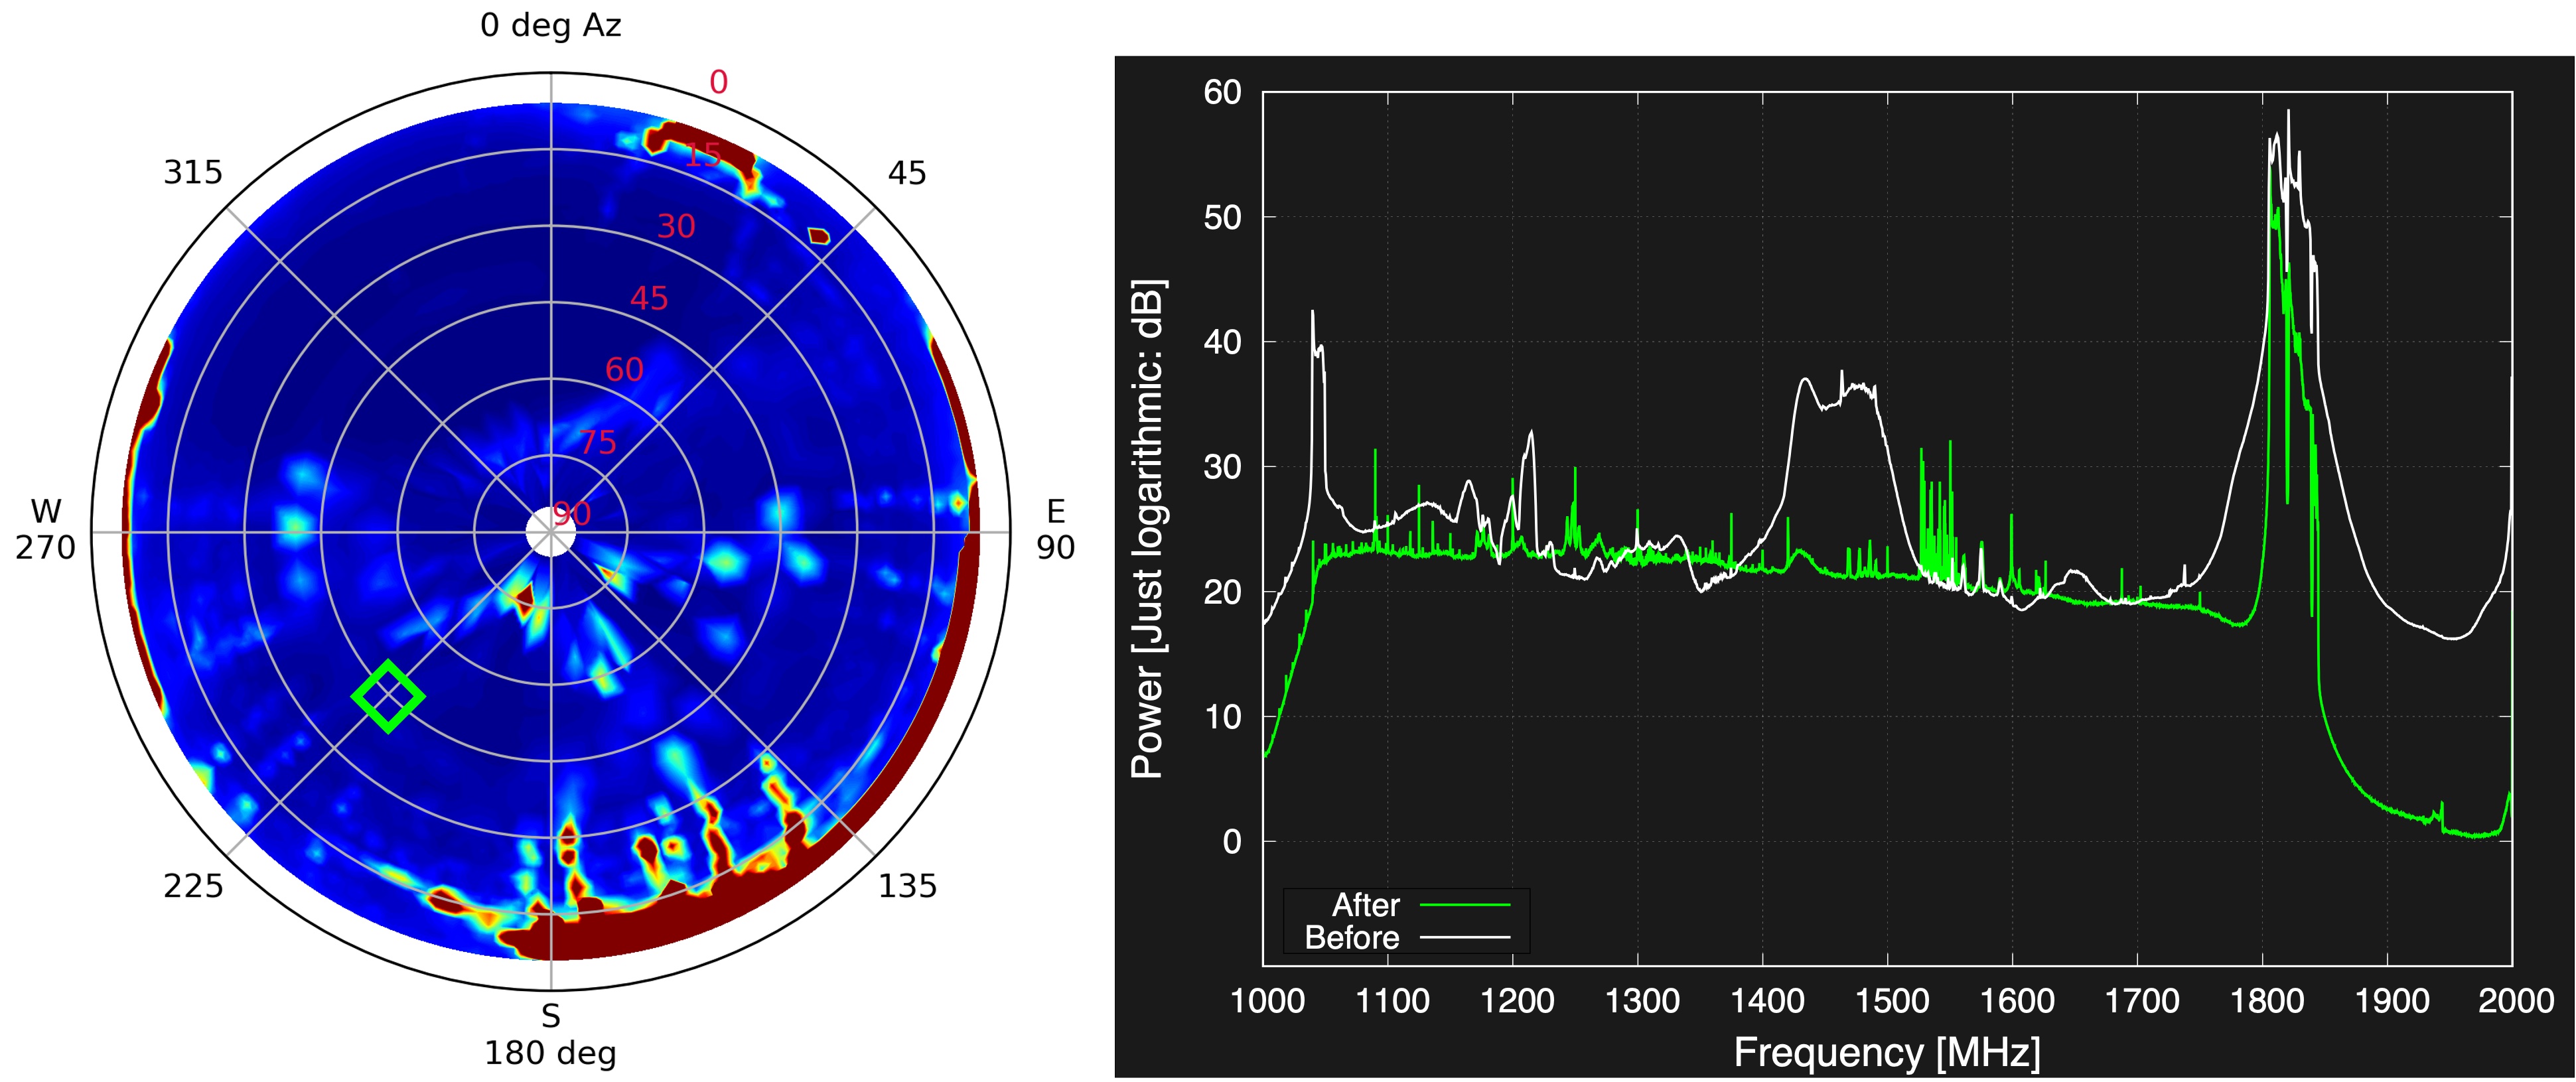
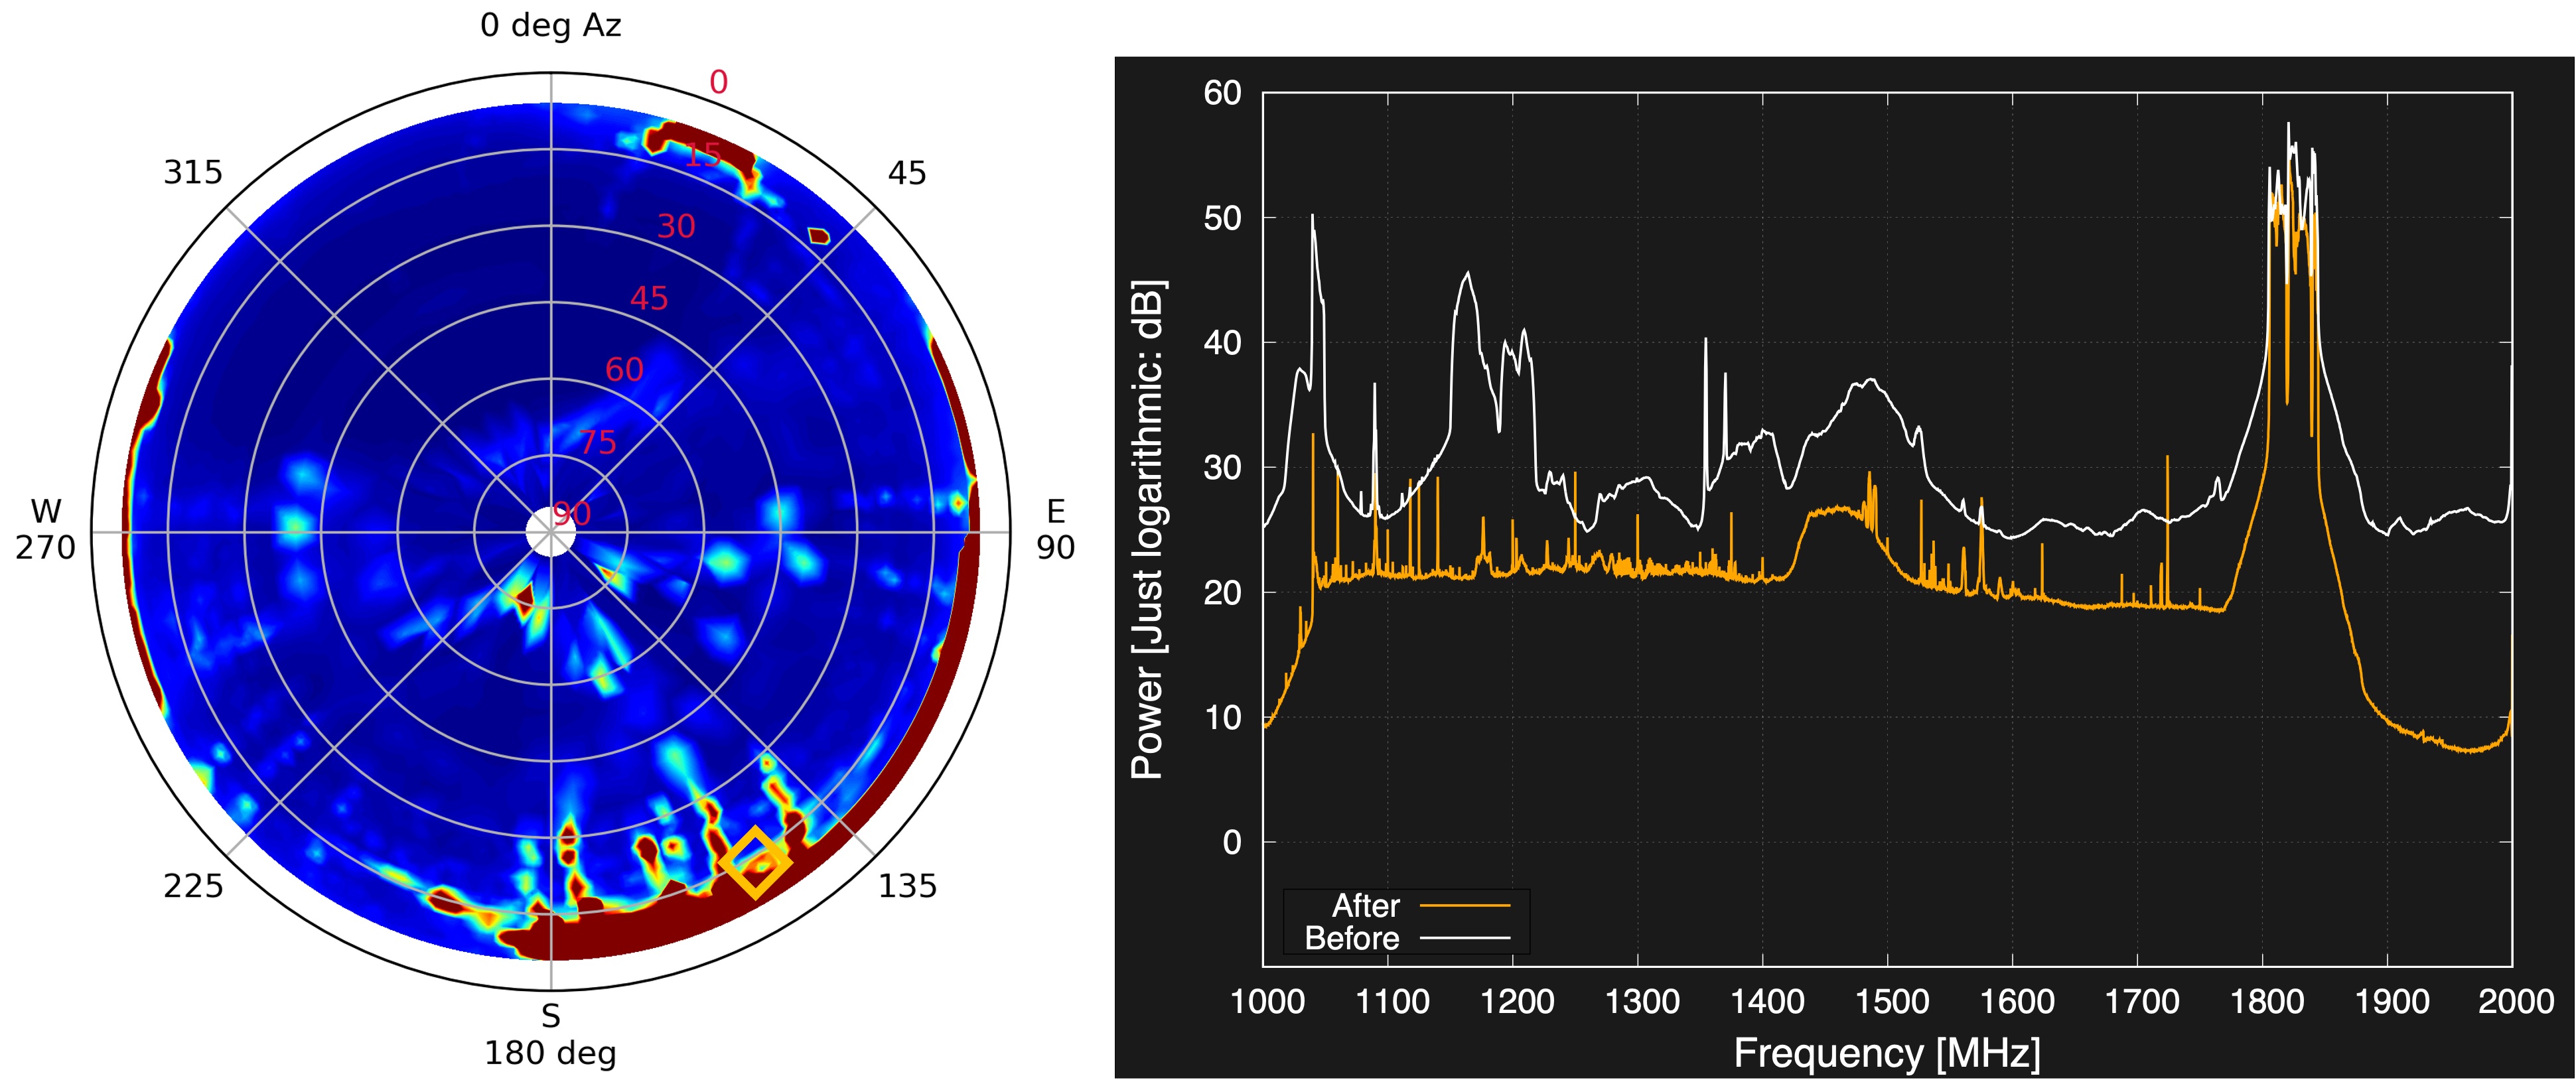
Figure 0-8: Comparison of the TNRT L-band spectra with vertical linear polarization at variety type of observable areas based on Tsys* observed before and after installation of the low-noise filter: Left - clarifying the area by rectangle on the skyline map of April 2023; Right - spectra comparison in the frequency range of 1.0-2.0 GHz. (Upper) Spectra at one of the best Tsys* areas, (AZ, EL) = (330, 45) deg before (white) and after (cyan). (Middle) Spectra at one of moderate Tsys* areas, (AZ, EL) = (225, 45) deg before (white) and after (green). (Lower) Spectra at one of much worse Tsys* areas, (AZ, EL) = (150, 13) deg before (white) and after (orange).